Blog
11-12-07
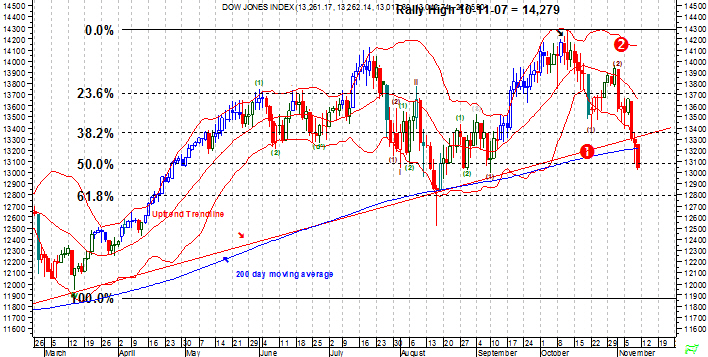
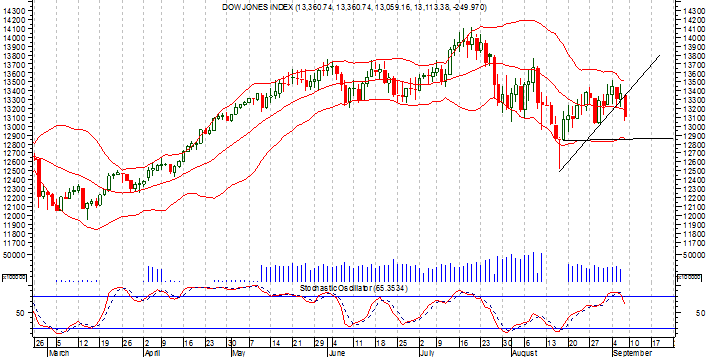
Short Term Market Outlook
The Dow Jones 30 Index has fallen 50% from it's rally high of 14,279
and could rebound soon however it also has broken below it's long
term uptrend line from the March lows and fallen below it's 200 day
moving average which is psychologically negative for market technicians
. If the downtrend continues the next level of support is at the 61.8%
Fibonacci retracement level of 12,845.
10-29-07
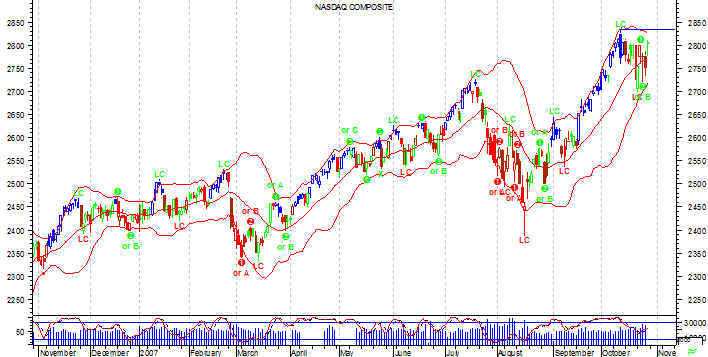
Short Term Market Outlook
The Nasdag Composite Index is in neutral territory for
overbought/oversold indicators. The current Elliott Wave count for 2%
impulse waves is #3. Resistance on the daily chart is at the
October 11th intra-day high of 2,834. If resistance is broken
expect a continued major move up for the index.
10-19-07
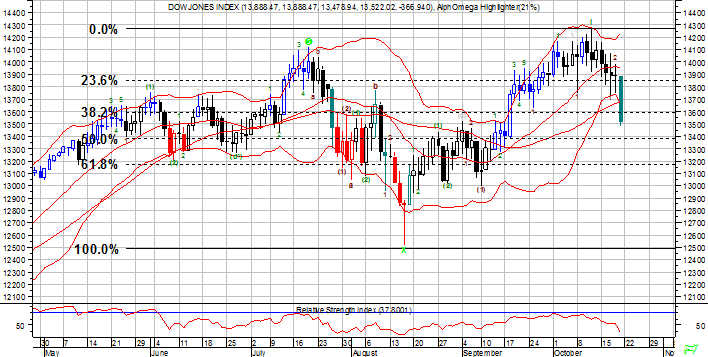
Short Term Market Outlook
The Dow is oversold on the intra-day charts however
on the daily charts the Dow has started a short term wave 3 impulse down
move. We expect the Dow to have a bounce up day then continue the short
term trend down to the Fibonacci 50 % retracement level at 13,400
before possibly resuming the next intermediate move up.
10-01-07
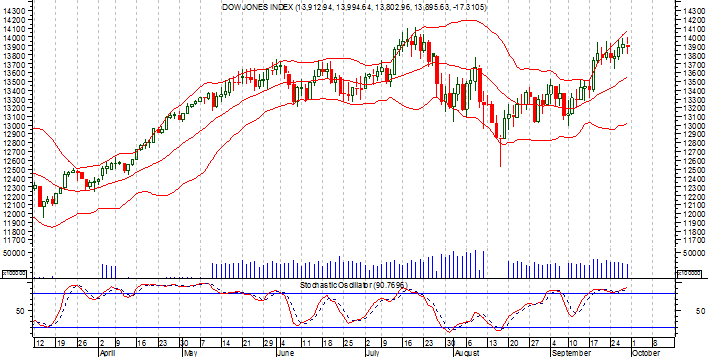
Short Term Market Outlook
The Dow and other major indices are extended or
overbought. Support for the Dow is at it's 20 day simple moving average.
With upcoming quarterly earnings season approaching any pullbacks
present buying opportunities and chances for volatility plays.
9-10-07
Short Term Market Outlook
The major indices are extended or overbought. The Dow
has broken it's short term uptrend line and near term support is at the
lower Bollinger Band at 12,870. Any test of support is a great
buying opportunity.
9-03-07
The Long Option Straddle
A
long option straddle is a purchase of a call option and put option
on the same security at the same or different strike prices. The
option straddle strategy works best on high volatility securities or
during volatile events. We prefer to purchase straddles on stocks the
session before the stock's earnings report is released and for futures
or commodities we prefer to purchase straddles before key economic or
agricultural reports are released.
8-27-07
Using stops and capital preservation
The primary method we use to enter trades is
price alert stops as confirmation for system signals, on buy signals we
use price alerts set at the previous sessions high and on sell signals
we use price alerts set at the previous sessions low. After entering
positions we preserve our capital by using trailing stops normally set
at the previous sessions high or low.
8-20-07
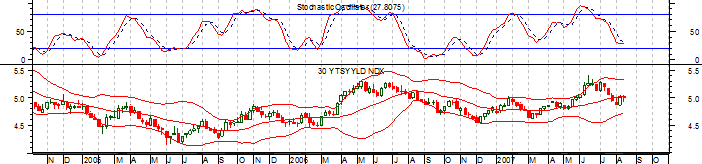
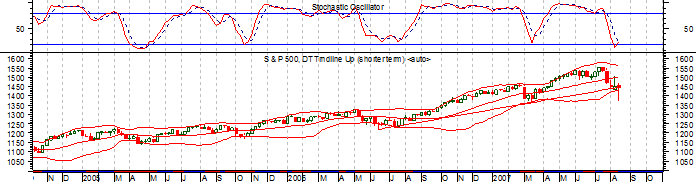
A new cycle begins?
One of the market and fund timing indicator
tools we use is a comparison chart of the weekly 30 year bond yield
versus the weekly S&P 500. As you can observe from the troughs and peaks
in the bond yield when the yield is low and trends down the market tends
to rally and when the yield is high and trends up the market stalls or
corrects. Now with the Federal Reserve leaning toward a loosening of
rates the yield may trend lower and the markets should continue to rally
for some time.
Weekly 30 Year Bond Yield ( Interest Rate)
Weekly S&P 500
home :
forums :
signals :
support :
contact
Copyright © 2007 MarketsForum.com
|